| Iontophoretic application of unconjugated cholera toxin B subunit (CTb) combined with immunohistochemistry of neurochemical substances: a method for transmitter identification of retrogradely labeled neurons |
| Luppi P.H., Fort P., Jouvet M. Brain Res. 534 (1-2) pages : 209-224 (1990) |
Results
In this report, we demonstrate that cholera-toxin B subunit (CTb) is
a very sensitive retrograde tracer in the central nervous system when
recognized by streptavidin-peroxidase immunohistochemistry. We further
show that:
(1) injection of a small volume of CTb gives rise to small sharply defined
injection sites limited to the cell group of interest associated with
the labeling of all the known afferent projections,
(2) CTb is taken up, and anterogradely as well as retrogradely transported
in damaged but not in intact fibers of passage,
(3) CTb can be applied iontophoretically, allowing us to study the afferents
to small cell groups without any evidence of tissue necrosis in the sites
and therefore without artefactual labeling due to uptake by damaged fibers
of passage,
(4) the use of 4% paraformaldehyde fixative ideally suited for the preservation
of most neural antigens, the addition of a 48 h colchicine treatment and
the development of a double immunohistochemical method allow the biochemical
characterization of the cell of origin of particular pathways in the CNS,
(5) CTb is also anterogradely transported with an extensive filling of
axons and axon terminals and thereby opens up the possibility of identifying
simultaneously the afferents as well as the efferents of the group of
cells studied and finally
(6) the very long conservation of the preparation, the possibility of
counterstaining it and of making camera lucida drawings allow easy and
precise localization of the retrogradely labeled cells.
Introduction
The introduction of HRP as a retrograde tracer by Kristensson and Olsson 27 and La Vail and La Vail 31 has greatly accelerated our knowledge of neuroanatomy. Improvements of the original technique including the use of the more sensitive chromogen TMB 39-42, the microelectrophoretic delivery technique 18 and the introduction of the HRP conjugates with wheat germ agglutinin (WGA-HRP) 11 17 53 54 57 or cholera toxin (CT-HRP) 53 54 57 have further increased the sensitivity of the technique and permit one to obtain more restricted injection sites. The remarkable increase in the number of putative transmitters has further pointed to the need for methods allowing simultaneous identification of a pathway and its neurochemical identity. For this purpose, the histochemical detection of HRP and its conjugates using DABS 8 9 33 45 or stabilized TMB 46 has been successfully coupled with the immunohistochemistry of neurochemical substances on the same sections. However, such double labeling techniques present many drawbacks. The DAB induced stabilization of the TMB product greatly decreases the method's sensitivity, especially when this procedure is coupled with the non-optimal fixation required for immunohistochemistry 44 46. The sensitivity of other chromogens like DAB is very low 3 39-42. In addition, HRP, and to a lesser extent its conjugates with WGA and CTb, are rapidly degraded in the retrogradely labeled cells 53 54 57, making delicate the coupling with a colchicine treatment essential for the optimal visualization of peptidergic cell bodies 3.
The introduction of a variety of retrogradely transported fluorescent dyes raises another possibility of biochemically characterizing the cells of origin of specific pathways in the CNS 28 30. Indeed, with such tracers, the 4% paraformaldehyde fixative ideally suited for the preservation of most neural antigens can be used 12 19 47 51 56 and the tissue can be processed for immunohistochemistry to identify the neurotransmitter contents of the retrogradely labeled cells 6 19 30 47 51 56 .Moreover it is easy to distinguish between these fluorescent dyes and immunocytochemically stained cells by simply using appropriate excitation wavelengths for each. In addition, two different dyes can be combined to demonstrate collateralization of afferents 29 55. However, the majority of these fluorescent retrograde tracers are less sensitive than HRP visualized with TMB 1 23, retrogradely transported by damaged as well as undamaged fibers of passage 1 23 30 47 and leak from the labeled neurons during the immunocytochemical procedure 19 47 51 56 and microscope observations 24. Furthermore, these dyes cannot be iontophoretically injected and application by pressure damages the tissue and increases the minimum size of the injection sites 30 44.
To overcome the limitations inherent to these fluorescent tracers and the HRP conjugates, we previously introduced the use of unconjugated cholera toxin B subunit (CTb) directly recognized by immunohistochemistry 14 15 34-36 58-60, thereby avoiding the severe drawbacks of a direct histochemical detection of HRP. We demonstrated that CTb is a very sensitive retrograde tracer 34 when visualized by the immunohistochemical ABC technique of Hsu 22. We further showed that retrograde transport of CTb can be used in conjunction with immunohistochemistry of many neurotransmitters and enzymes in colchicine-treated animals perfused with 4% paraformaldehyde in order to biochemically characterize the labeled pathways 34 35.
In this report we confirm and extend the above findings. We demonstrate that :
- the sensitivity of CTb is further increased by using unlabeled streptavidin immunohistochemistry;
- CTb can be iontophoretically applied, thus allowing us to determine the afferents to very small groups of cells without significant tissue damage;
- CTb is not taken up, and retrogradely and anterogradely transported by intact fibers of passage;
- CTb is a very efficient anterograde tracer allowing thE detailed morphology of axons and terminals to be revealed.
Materials and Methods
Eighty adult eats of both sexes weighing 2.5-4.0 kg were used. The animals were deeply anesthetized with pentobarbital (25 mg/kg, i.v.)
(A) Retrograde labeling with cholera toxin B subunit (CTb)
(1) Preparation of the tracers
For pressure injeetions, 1 mg of lyophilized cholera toxin B subunit (CTb, List Biological Lab) was diluted in 100 µl of distilled water to a final concentration of 1% in the original buffer containing 0.5 M Tris-HCI (pH 7.5), 2 M NaCl, 0.03 M NaCl and 0.01 M EDTA. For iontophoretic injections, it appeared necessary to replace the original buffer by a phosphate buffer (PB) at pH 6.0. For this purpose, 1 mg of lyophilized CTb was reconstituted with 1 ml of 0.1 M PB (pH 6.0) and then desalted, buffer exchanged and concentrated to 1% by two repeated 1 h 30 min ultrafiltrations (from 1 ml to 0.1 ml) at 7000 rpm with a centricon-10 microconcentrator (Amicon, U.S.A.).
(2) Pressure injections
0.05, 0.1 or 0.2 µl of 1% CTb was injected stereotaxically with a 5-µl Hamilton syringe into several brainstem nuclei such as the nuclei reticularis magnocellularis and parvicellularis, the nucleus paragigantocellularis lateralis, the nuclei raphe magnus, pallidus and dorsalis, the locus coeruleus complex, the pontine reticular formation, the trigeminal motor nucleus, the facial nucleus, the posterior and anterior hypothalamic areas. After injection of CTb over 10-15 min, the needle was left in place for about 15 min.
(3) Iontophoretic injections
Glass capillary tubes (1 mm o.d., Clark Electromedical Instruments) were heated, pulled and the tips cut back to 12-25 µm diameter under microscopic control. Using vacuum lines, these micropipettes were filled with the 1% solution of desalted CTb in 0.1 M PB (pH 6.0) just prior to the injections. The pipettes were then lowered stereotaxically into the regions under study, such as the nuclei raphe dorsalis, reticularis parvicellularis, paragigantocellularis lateralis and the posterior and anterior hypothalamic areas. A pulsed positive current (7 s on, 7 s off) was then applied using a Midgard CS-4 to avoid electrocoagulation. We tested the effect of different intensities of current (2,5 µA) as well as duration of injections (15, 30 min) on the diameter of the sites. At the end, the pipettes were left in place for 10-20 min to avoid leakage of the tracer along the pipette track.
(4) Colchicine treatment
In order to inject colchicine, two guide cannulae were implanted in the lateral and fourth ventricles just after the injection of CTb. Twenty-four hours later, the animals were treated with colchicine (200 ug in 20 µl of 0.9% saline for each ventricle) through the guide cannula by means of an injection cannula connected to a 50-µl Hamilton syringe. The animals were perfused 24 and 48 h after the colchicine administration. As controls, 10 cats did not receive colchicine treatment and were allowed to survive 24 h, 48 h, 10, 15 and 18 days after CTb pressure or iontophoretic applications.
(5) Perfusion and histology
The animals were deeply anesthetized and perfused through the ascending aorta, initially with one liter of Ringer's lactate solution containing 0.1% heparine, followed by 2.500 ml of an ice-cold fixative in 0.1 M PB (pH = 7.4). Four different perfusion regiments were tested:
(a) 2-4% paraformaldehyde (PF), 0-0.1% glutaraldehyde (GLU) and 0.2%
picric acid (PA);
(b) 4% PF, 0.25% GLU and 0.2% PA;
(c) 4% PF, 0.1% GLU and 0.2% carbodiimide;
(d) 5% GLU and 0.2% PA.
After removal from the skull, the brains were cut into several blocks, and postfixed overnight at 4 °C in 0.1 M PB containing 2% PF and 0.2% PA (fixation a,b,c) or 2.5% GLU and 0.2% PA (fixation d). The blocks were then rinsed and cryoprotected by immersion in 0.1 M PB containing 30% sucrose for 48-72 h at 4 °C. Afterwards, these specimens were rapidly frozen with CO2 gas and coronal 20 µm thick sections were cut on a cryostat. In a few cases, vibratome sections 40-100 µm thick were obtained using a sliding microtome (Oxford Instruments). The free-floating sections were then incubated in CTb antiserum or stocked up to 4 years before staining m 0.1 M phosphate-buffered saline containing 0.3% Triton X-100 (PBST) and 0.1% sodium azide (PBST-AZ, pH = 7.4).
(B) Immunohistochemistry of CTb
Immunohistochemical detection of CTb was carried out by sequential incubations of free-floating sections using the modified technique of Hsu 22 or the classical PAP method. We used two different incubation times under gentle stirring in the goat CTb antiserum (List Biological Laboratories):
(1) a short incubation overnight at room temperature at 1:20 000 dilution in PBST in order to visualize the injection site the day after cutting;
(2) a long incubation over 3-4 days at 4 ° C in PBST-AZ with a 1:40 000 dilution for double labeling experiments.
After incubation in CTb antiserum, the free floating sections were rinsed 2 x 30 min in PBST and then successively incubated for 90 min at room temperature or overnight at 4 °C in the linking antibodies and the streptavidin-HRP, ABC-HRP complex or goat PAP using one of the following protocols:
(a) donkey anti-goat immunoglobulin (1:1,000, Jackson Immunoresearch Lab.) followed after 2 x 30 min rinses in PBST by goat PAP (1:1,000, Jackson Immunoresearch Lab.)
(b) biotinylated swine anti-goat immunoglobulin (1:1,000, Tago) followed after 2 x 30 min rinses in PBST by the ABC-HRP complex (1:500-1,000, Vector Lab.);
(c) biotinylated donkey anti-goat immunoglobulin (1:2.-4,000, Jackson Immunoresearch Lab.) followed after 2 x 30 min rinses in PBST by the ABC-HRP complex (1:500-1,000, Vector Lab.);
(d) biotinylated donkey anti-goat immunoglobulin (1:2-4,000, Jackson Immunoresearch Lab.) followed after 2 x 30 min rinses in PBST by streptavidin-HRP (1:40,000, Jackson Immunoresearch Lab.).
Finally, in all cases, after 2 x 30 min rinses in PBST, the free floating sections were immersed in 0.02% 3,3'-diaminobenzidine4HCl (DAB, Sigma) containing 0.003% H2O2 and 0.6% nickel ammonium sulfate in 0.05 M Tris-HCl buffer (pH = 7.6) for 10-15 min at room temperature. The reaction was terminated by extensive washes in PBST.
(C) Immunohistochemistry of neurotransmitters and their synthesing enzymes
To determine the histochemical nature of the retrogradely labeled cells, the CTb-pretreated sections were incubated for 4-6 days at 4°C in "rabbit" antiserum diluted in PBST-AZ to either:
- tyrosine hydroxylase (TH, 1:10,000, Institut Jacques Boy, France).
- serotonin (5-HT,1:20,000, a gift of Pr. Kimura, Japan).
- methionin-enkephalin (M-Enk, 1:5,000, UCB, Belgium).
- substance P (SP,1:5,000, Biogenex, U.S.A.).
- corticotropin-releasing factor (CRF, 1:5,000, UCB,Belgium).
- neurophysin (NP, 1:80,000, DAKO, Denmark).
- somatostatin (SRIF,1:5,000, DAKO, Denmark).
- neurotensin (NT, 1:40,000, Milab, Sweden).
- a-melanocyte stimulating hormone (a-MSH, 1:40,000, UCB, Belgium).
- cholecystokinin (CCK, 1:5,000, UCB, Belgium).
- galanin (GAL, 1:20,000, Peninsula, U.K.).
- choline-acetyltransferase (ChAT, 1:5,000, Chemicon, U.S.A.).
- u-amino acid decarboxylase (AADC, 1:20,000, a gift of Dr. Weber, France).
After 2 x 30 min washes in PBST, the sections were placed for 90 min at room temperature or overnight at 4 °C in swine (1:400, DAKO) or donkey (1:800, Jackson Immunoresearch Lab.) antirabbit immunoglobulin diluted in PBST. They were then rinsed 2 x 30 min in PBST and immersed in rabbit peroxidase-antiperoxidase (PAP, DAKO, Jackson Immunoresearch Lab.) diluted 1:400-1000 in PBST for 90 min at room temperature. After 2 x 30 min rinses in PBST, the sections were reacted with 0.025% DAB containing 0.006% H2O2 in 0.05 M Tris-HCI buffer for 15-30 min at room temperature.
Finally, the sections were mounted on gelatin-coated glass slides, dried, dehydrated and coverslipped with Depex.
The CTb reaction products obtained by DAB-nickel histochemical procedure consisted of black punctate granules in the cell soma and dendrites, whereas for the neuroactive substances the immunohistochemical reaction product revealed using DAB appeared as a homogeneous light-brown staining of the cell bodies.
Results
(A) Injection sites
(1) General remarks
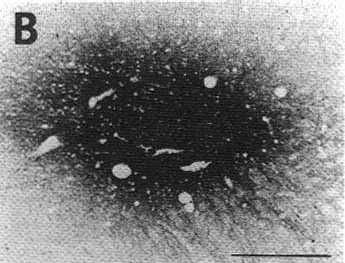
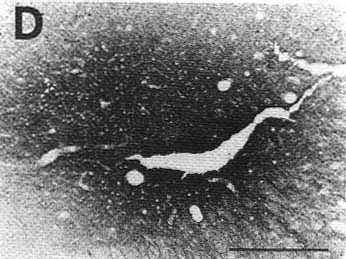
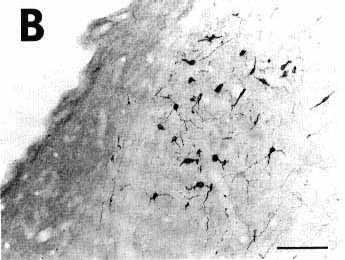
As illustrated in Fig. 1B and D showing adjacent sections stained either with the ABC-HRP complex (Fig. 1B) and streptavidin-HRP (Fig. 1D), the aspect of the pressure and iontophoretic injection sites depended on the reagents used for the third step of the immunohistochemical procedure. Indeed, when using the ABC complex, whatever the secondary biotinylatod antiserum to goat, the center of the site was darkly stained while the periphery only contained a moderate to small quantity of granular material. In contrast, using streptavidin-HRP in the same conditions, the center of the site was less intensively labeled while the periphery appeared darker, containing a high density of granular material including immunostained fibers emanating from the site in all directions (Fig. 1D). Despite these differences, the diameter of the site remained approximately identical with both systems of detection.
On the other hand, we observed that the diameter and the aspect of the sites did not significantly change with different times of survival (24 h, 48 h, 10, 15 and 18 days) or the addition of a 48-h colchicine treatment.
We determined also that injections of the same volume of CTb resulted in sites of slightly variable shapes and diameters, clearly depending on the concentration of cell bodies and the presence of blood vessels and fiber bundles in the injected region.
(2) Pressure injections
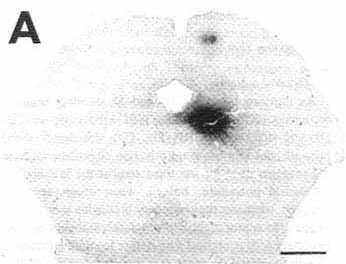
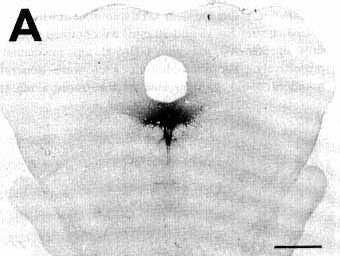
The CTb pressure injection sites obtained when using a Hamilton syringe were generally round or ovoid, less frequently with a droplet shape when the tracer slightly leaked along the needle track. The diameter of 0.2, 0.1 and 0.05 µl CTb injection sites was commonly in the range of 800-1200 um, 600-1000 µm and 600-800 µm respectively. Fig. 1A illustrates a representative 0.2 µl pressure injection site in the ventrolateral part of the periaqueductal gray.
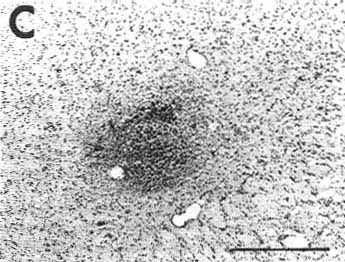
To determine whether the tissue was damaged at the level of the site, we counterstained with Cresyl violet unlabeled sections adjacent to those immunostained for CTb. After a typical injection of 0.2 µl of CTb giving a site of 800-1200 µm in diameter, we always detected a 500-800 µm diameter lesion of cell bodies in the central core of the sites. At the center of this lesion, the fibers were also totally destroyed in an area exactly corresponding to the mechanical injury made by the 400 µm diameter needle of the Hamilton Syringe. Fig. 1C illustrates the extent of the tissue necrosis at the level of 0.2 µl site in the periaqueductal gray shown in Fig. 1B and D on a Cresyl violet-counterstained section.
(3) lontophoretic injections
First, after iontophoretic injections of CTb in the initial buffer (1% in 0.5 M Tris-HCI, pH 7.5), we found only a trace of CTb immunoreactivity at the level of the site and no retrograde labeling. In sharp contrast, iontophoretic application of a 1% desalted and buffer exchange solution of CTb in 0.1 M PB (pH 6.0) through micropipettes with a 12-25 µm tip diameter using 2 uA pulsed positive current for 15 and 30 min gave respectively CTb injection sites of 200-300 µm and 400-600 µm in diameter. Using the same CTb solution but with a 5 uA pulsed current for 15 and 30 min, we obtained injection sites of 300-400 µm and 600-800 µm in diameter respectively. The iontophoretic sites were generally round or ovoid with no leak of the tracer along the pipette track. Fig. 2A and B illustrates a typical iontophoretic injection site (2 uA, 30 min) in the nucleus reticularis parvicellularis (Pc) of the medulla oblongata. A larger site (800 µm in diameter) in the nucleus raphe dorsalis obtained after a 60-min injection time with a 2 uA current parameter is shown in Fig. 3A.
To determine whether tissue damage occurred at the level of the sites in the Pc, we made a serotonin immunoreaction and then counterstained with Cresyl violet sections adjacent to those revealed by CTb. The 5 uA current produced an electrolytic lesion of 100-150 µm diameter at the center of the injection site while, as shown in Fig. 2D, with 2 uA current we hardly detected the 20 µm trace of the micropipette track. Moreover, we observed no visible destruction of serotonin fibers nor of any counterstained cell bodies despite their large number in the site.
Finally, it must be stated that the current of 5 uA but not 2 uA caused severe instability of the impedance of the CTb-filled micropipettes.
Results
(B) Retrograde labeling
(1) Influence of the immunohistochemical protocol
In an attempt to maximize the CTb retrograde labeling, we tested the sensitivity of different immunohistochemical protocols and the influence of several parameters such as the incubation duration and temperature for each step of these procedures.
In a first series of experiments, we compared the sensitivity of two different secondary antibodies and that of the goat PAP, the ABC-HRP complex and streptavidin-HRP. For this purpose, adjacent sections were incubated in CTb antiserum at a 1:40,000 dilution for 4 days at 4 °C and then submitted to 4 different protocols:
(a) donkey anti-goat IgG (1:1,000) and goat PAP (1:1,000);
(b) biotinylated swine anti-goat IgG (1:2,000) and ABC-HRP complex (1:500);
(c) biotinylated donkey anti-goat IgG (1:2,000) and ABC-HRP complex (1:500);
(d) biotinylated donkey anti-goat IgG (1:2,000) and streptavidin-HRP complex (1:40,000).
Incubations in each compound lasted 90 min at room temperature in PBST. The sections were then reacted using the standard DAB-nickel procedure (see Materials and Methods).
Using any one of the protocols, the retrogradely labeled cells were characterized by the presence of dark blue granular reaction products in their cytoplasm ofter extending to their proximal dendrites. Nevertheless, we found that, when using the classical PAP method, the labeling was very faint when compared with that observed using the ABC-HRP complex and streptavidinHRP. The best results were obtained with streptavidinHRP associated with the biotinylated donkey anti-goat IgG (protocol d). Indeed, using such a protocol, the number, intensity and dendritic labeling of the retrogradely labeled neurons dramatically increased. We further determined, comparing the results obtained with protocols b, c and d, that this increase in sensitivity was due to the combined superiority of streptavidin-HRP and the biotinylated donkey antigoat IgG over the biotinylated swine anti-goat IgG and the ABC-HRP complex. It is important to note that this dramatic gain in sensitivity was not associated with an increase in the diameter of the injection sites as shown in Fig. 1B and D (see general remarks).
In our first reports using the CTb retrograde tracing method 34 36, we used the ABC-HRP complex and biotinylated swine anti-goat IgG (protocol b) to reveal CTb, while in the recent studies we introduced the more sensitive streptavidin-HRP and biotinylated donkey antigoat IgG (protocol d) 14 15 58-60. Therefore, we found it necessary to quantify the gain of sensitivity obtained when using these last two products as well as their respective contribution to this increase. For this purpose, we counted the number of CTb cells on adjacent sections stained with either b, c or d protocols. We found an 84% increase in the number of retrogradely labeled cells between the b and d protocols (when counting neurons on adjacent sections labeled with protocols b and d). This increase in sensitivity was due for 45% to the biotinylated donkey anti-goat IgG (deducted from adjacent sections labeled with protocols b and c) and for 25% to streptavidin-HRP (deducted from cell count on adjacent sections stained with protocols c and d).
In a second series of experiments, we compared the intensity and aspect of the retrograde labeling according to the length and the temperature of the incubation, in the primary and secondary antibodies as well as in streptavidin-HRP. We were able to reveal the injection sites and the retrograde labeling even after a short overnight incubation at room temperature in CTb antiserum (1:20,000) followed by a 1 h 30 min incubation in the linking antiserum (1:2,000) and streptavidin-HRP (1 :40,000). This protocol allowed us to examine the results 24 h after cutting the sections. However, this fast procedure gave less intense and less complete retrograde labeling than the slow procedure consisting of a 3-4 day incubation at 4 °C in CTb antiserum (1:40,000) and 90 min incubations at room temperature in the linking antibody (1:2000) and streptavidin-HRP (1:40,000). In such conditions, the staining of the retrogradely labeled cells was intense and granular and the background staining was very limited. Therefore, this immunohistochemical procedure was ideally suited for double labeling experiments (see below). When using the same concentration of linking antibody and streptavidin-HRP, but with an overnight incubation at 4 °C, the intensity of the retrograde labeling further increased and in some cases the cell bodies were completely filled with black granules. However, we also observed a concomitant increase of the background.
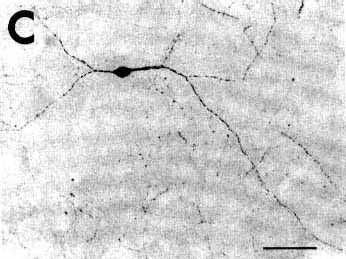
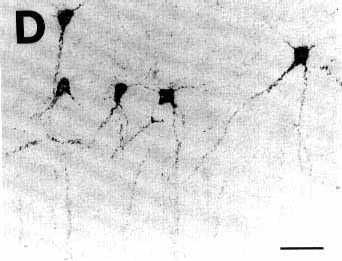
On the other hand, we determined that the CTb immunostaining did not significantly decrease on sections stocked in PBST-AZ or mounted on slides. We also found a better preservation of the morphology and a more complete staining of the retrogradely labeled cells on vibratome than on cryostat sections. Indeed, as illustrated in Fig. 4, the CTb retrograde labeling was Golgi-like with an extensive filling of the dendritic trees.
(2) Influence of the fixative
We checked several types of fixative with variable concentrations of PF, GLU, carbodiimide and PA. We obtained the best results using a fixative composed of 4% PF, 0.1% GLU and 0.2% PA. When using an increasing concentration from 0.1 to 5% of GLU, we observed a concomitant gradual decrease in intensity of the CTb labeling and an increase of the background staining. With 5%, we were unable to distinguish the specific staining from the background. However, this phenomenon can be almost eliminated and the specific stain reappeared when the sections were pretreated with 0.4% borohydride in PBS for 5-15 min.
The addition of as little as 0.2% carbodiimide to a 4% PF fixative gave rise to unexpected artefactual labeling of the myelinated fibers and a less sharp although intense punctate retrograde labeling.
(3) Characteristics of CTb as a retrograde tracer
After CTb pressure and iontophoretic injections, even after the shortest survival (24 h) and for the most limited iontophoretic applications (200 µm in diameter), retrograde labeling was observed in all investigated pathways and there was no absence of uptake or transport in any particular neuronal groups. These findings indicate that, in contrast with nearly all the other retrograde tracers, CTb can be used to map the afferents to very small groups of cells. Large iontophoretic injections sites (400-800 um) gave rise to an extensive retrograde labeling comparable with the smaller pressure injections (0.05 µl, 600-800 µm in diameter).
No evidence of anterograde and retrograde transsynaptic labeling was observed even after 18 days of survival.
We also found no decrease in the number of retrogradely labeled cells nor in the intensity of their staining in cats with 72 h of survival including 24 or 48 h of colchicine treatment nor in those with 10, 15 and 18 days of survival. On the contrary, as illustrated in Fig. 3C and D, we observed an increase in the staining of the retrogradely labeled neurons as well as a much more extensive labeling of their dendritic trees after 10, 15 and 18 days of survival.
Results
(C) Artefactual labeling due to uptake by fibers of passage
After pressure applications in fiber bundles such as the lateral vestibulo-spinal and olivo-cerebellar tracts, the medial lemniscus and medial longitudinal fasciculus, we observed CTb immunostaining of fibers belonging to these tracts not only in the anterograde direction up to the terminals but also in the retrograde direction all the way to their retrogradely labeled parent cell bodies. For example, following pressure injections in the olivocerebellar tract, axons were immunostained on their way back to their retrogradely labeled parent cell bodies in the contralateral inferior olivary complex but also as far as their terminals in the cerebellum. These findings clearly demonstrate that CTb is taken up, and anterogradely but also retrogradely transported by fibers of passage. However, many points suggest that this uptake occurred only in damaged fibers of passage. Indeed, after CTb pressure injections centered on the lateral vestibulospinal tract with its destruction by the needle of the Hamilton Syringe, we detected a number of retrogradely labeled cells in the Deiters nucleus as well as immunostained fibers in the tract rostral and caudal to the injection site. In contrast, when the site involved the tract but without mechanical injury to it, no labeled cells were observed in the Deiters nucleus nor any labeled fibers in the tract. Furthermore, in contrast with pressure injections, 2- uA iontophoretic applications with 20-um micropipettes centered on the olivocerebellar tract gave rise only to occasional retrogradely labeled neurons in the contralateral olivary complex and no or only a few labeled fibers in the tract. Taken together, these results indicate that CTb is taken up and transported by damaged but not by intact fibers of passage, a drawback nearly eliminated by iontophoretic applications. Importantly, in contrast to the specific anterograde labeling (see below), the artefactual labeling of lesioned fibers was observed for long pathways even after the shortest survival (24 h), suggesting that CTb is transported in lesioned axons by a fast axonal transport mechanism. For example, after CTb injections in the fasciculus longitudinalis medialis at the level of the raphe dorsalis and 24-72 h of survival, we detected anterogradely labeled lesioned fibers 13 mm caudally in the inferior olivary complex.
Results
(D) Anterograde tracing
As described above, we observed intense retrograde and anterograde immunostaining of lesioned fibers particularly after CTb pressure injections in fiber bundles. However, many features indicated that a specific anterograde transport of CTb arose from the neurons localized in the sites of injection to their terminals. Indeed, after iontophoretic injections without any destruction of fibers of passage, immunostained fibers formed bundles which could sometimes be followed over several millimeters terminating with many arborizations in the well-known efferents of the injected region. The morphology of the labeled axons and axon terminals was clearly demonstrated including boutons en passant, fine collateral branches and various terminal specializations.
For example, as illustrated in Fig. 2, after an iontophoretic injection in the nucleus reticularis parvicellularis of the medulla oblongata (Pc) and 72 h of survival including 48 h of colchicine treatment, we observed a bundle of fibers arising from the site taking a ventral route in the rostral medulla (dorsal to the facial nucleus, Fig. 2E) and caudal pons, ascending ventrally to the trigeminal motor nucleus and terminating with many arborizations in the nuclei parabrachialis lateralis and Kolliker-Fuse at the level of the pons (not illustrated). We also found numerous varicose labeled fibers in the hypoglossal (Fig. 2E), facial (Fig. 2D) and trigeminal motor nuclei. These fibers are likely to be anterogradely labeled because previous anterograde20 as well as retrograde 14 15 tracing studies demonstrated a massive efferent projection from the Pc to these cranial motor nuclei as well as to the pontine nuclei parabrachialis lateralis and Kolliker-Fuse.
On the other hand, we never detected bundles of retrogradely labeled fibers in the well characterized pathways from the bed nucleus of the stria terminalis and the central nucleus of the amygdala to the Pc despite the considerable number of retrogradely labeled cell bodies found in these nuclei. These results demonstrate that, although necessarily present in the fibers arising from the retrogradely labeled cells, CTb is below the detectable level in these fibers.
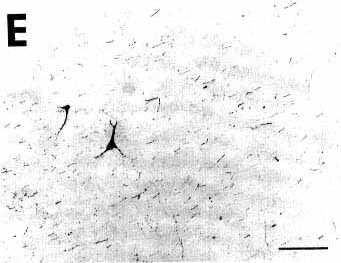
Taken together, these findings prove that CTb can be used as an anterograde tracer. We further determined that the extent of this anterograde labeling depended on the time of survival. Indeed, in cats with short survivals (24-72 h), we detected anterograde labeling only 6-8 mm away from the site. For example, after pressure or iontophoretic injections of CTb in the nucleus raphe dorsalis (NRD) and 72 h of survival including 48 h of colchicine treatment, anterograde labeling was observed only for 6-8 mm in the midbrain and pons. In contrast, as shown in Fig. 3E and F, in a cat with an iontophoretic application of CTb in the NRD, 18 days of survival and no colchicine treatment, we observed a very extensive anterograde labeling of fibers in the median forebrain bundle (Fig. 3E) and many terminal arborizations in forebrain and frontal cortical areas (Fig. 3F). These results corroborate the previous autoradiographic anterograde study of Bobillier et al. 7 and demonstrate that CTb is anterogradely transported via a slow axonal mechanism.
It must also be noted that the quality of this anterograde labeling highly depended on the immunohistochemical technique used. Indeed, we determined that it was much more extensive when using streptavidin-HRP rather than ABC-HRP. With ABC-HRP, the staining of axons and axon terminals was limited to their varicosities and therefore looked granular, whereas it completely filled them when using streptavidin-HRP (see Fig. 3E and F). This result confirms the greater sensitivity of streptavidin-HRP over ABC-HRP.
Results
(E) Double immunostaining technique
In addition to its very high sensitivity, the great advantage of our technique is to afford the opportunity of determining by a second immunohistochemical procedure the neurotransmitter content of the identified pathway. For this purpose, we have developed a double immunostaining procedure on the same sections including the combination of colchicine treatment and retrograde tracing by CTb.
We have shown above that the retrograde labeling of CTb is complete 24 h after injection. Therefore, we administered colchicine at this time by means of two previously implanted cannulae. We tested the effect of 24 and 48 h of colchicine treatment on the retrograde tracing (see above) and on the immunohistochemical identification of neurotransmitters and their synthesizing enzymes. We determined that the colchicine treatment only slightly increased the staining intensity of the neurons when using antisera to the enzymes ChAT, TH and PNMT. In contrast, the number of immunostained cells as well as their staining intensity dramatically increased for the neuropeptides and the neurotransmitters like serotonin, the more so with a 48 h colchicine treatment.
The identification of the histochemical nature of the retrogradely labeled cells is based on the differential aspect of CTb-(punctate) and neurotransmitter (homogeneous)-immunoreactive material in the cell bodies that are well contrasted by the use of two different chromogens (DAB-nickel and DAB) on the same sections for the first and second immunostaining respectively. The double-labeled cells were then easily recognized by the presence of black punctate granules over a brown diffusely stained cytoplasm (Fig. 5).
The straightforward identification of the double-labeled cells requires at least 3 imperative conditions:
(1) the second immunohistochemical procedure should not cross-react with the first, thereby avoiding the observation of false double-labeled neurons;
(2) the black punctate reaction products of CTb should not completely fill the cell bodies whereby observation of the brown deposit becomes difficult;
(3) the homogeneous brown deposit of the second immunohistochemical procedure should not mask the black CTb punctate reaction product.
To eliminate the first possibility, we used different species antisera directed against CTb (goat) and the neuroactive substances (rabbit). We selected second antisera that had been passed through agarose gels containing immobilized serum proteins from the other species to maximally minimize cross-reactivity between the two procedures. We also used the highly sensitive streptavidin-HRP reagent to detect CTb and the classical PAP technique for the neurotransmitters and their synthesizing enzymes. In this way, we completely eliminated the cross-reactivity between the two immunohistochemical procedures. Indeed, we observed an unacceptable artefactual labeling and cross-reaction when using the streptavidin-HRP for the two procedures while we obtained only a faint retrograde labeling of CTb when using the goat PAP (see above). In contrast, the use of rabbit PAP for the immunohistochemical detection of the neuroactive substances, although less sensitive than streptavidin-HRP, gave rise to an extensive and intense labeling of the cell bodies.
With regard to the last two points, first, we selected the appropriate procedure to detect CTb, i.e. with the maximal sensitivity but giving a granular staining of theretrogradely labeled cells, without any background (see above). Secondly, we determined the appropriate dilution for each antibody directed against the neuroactive substances (see Materials and Methods) as well as for the IgG (1:400-800) and the rabbit PAP (1:400-1000) in order to obtain a homogeneous brown deposit sufficiently light to avoid masking of the black granules of CTb. The color photomicrographs shown in Fig. 5 illustrate representative examples of double-labeled neurons containing black granules of CTb material and a brown homogeneous deposit. Note that the double labeled cells can be easily identified even at a low magnification (Fig. 5A) and that the neurons containing only CTb punctate retrograde labeling did not show any trace of brown deposit, thus indicating the absence of cross-reaction between the two successive immunohistochemical procedures.
Discussion
This report is an attempt to demonstrate that unconjugated CTb is a versatile and sensitive retrograde tracer when recognized by immunohistochemistry. Any evaluation of the quality of a retrograde tracer must include at least the following considerations:
(1) the incorporation and retrograde transport by all cell types without transsynaptic labeling;
(2) the ability to reveal the neuron afferents to a small injection limited to the cell group of interest;
(3) the degree of uptake and transport by damaged and undamaged axons of passage;
(4) the compatibility with immunohistochemistry of neuroactive substances.
With regard to these considerations, using unconjugated CTb as a retrograde tracer, the following was demonstrated:
(1) in all pathways investigated, we never observed the absence of a well-known afferent projection, indicating that CTb is taken up and retrogradely transported aspecifically by all the neurons of the central nervous system;
(2) pressure and furthermore iontophoretic applications of a small volume of CTb give rise to small injection sites limited to cell groups of interest associated with the labeling of all the known afferent projections;
(3) CTb is taken up only by damaged fibers of passage, a drawback largely overcome by iontophoretic application with 20 µm micropipettes;
(4) the use of a 4% paraformaldehyde fixative, the absence of decrease of labeling after long survival and colchicine treatment, the easy and straightforward identification of double labeled neurons containing black granules contrasting well with the brown reaction product allowed us to combine immunocytochemical detection of CTb with the immunohistochemistry of multiple neuroactive substances to determine the histochemical nature of afferent projections.
Moreover, this technique has the advantage of the permanence of the preparation. Indeed, it is possible to stock sections before and after staining in PBST-A or mounted on slides for years without any loss of immunoreactivity. Moreover, camera lucida drawings can be easely made at low magnification to accurately localize the retrogradely labeled cells.
These results complete those obtained by us 14 15 34 36,58-60 and Ericson et al. 13. In agreement with these previous studies, we confirmed that CTb is a very sensitive retrograde tracer extensively filling the dendrites of the retrogradely labeled cells. In addition to these studies, we demonstrated that CTb is taken up and transported in damaged but not in intact fibers of passage, can be iontophoretically applied and that the sensitivity of the tracer is further enhanced when using streptavidin-HRP immunohistochemistry. It must also be noted that, in contrast with Ericson et al. 13, we found that the CTb immunoreactivity in the retrogradely labeled cells was granular rather than homogeneous even on vibratome sections and that we observed no regional difference in the intensity of the retrograde labeling.
It would be of interest to compare the sensitivity of unconjugated CTb recognized by immunohistochemistry with that of CTb-HRP recognized with TMB. However, it is not possible because the optimal fixative conditions are very different for these two systems of detection. Nevertheless, Shapiro and Miselis 49, after restricted injections of CTb-HRP in the area postrema, described an intense retrograde labeling with an extensive filling of the dendrites of the retrogradely labeled cells as well as an extensive anterograde labeling of fibers, indicating the high sensitivity of the TMB method. It remains to be determined whether CTb-HRP, like CTb, can be iontophoretically applied. In any case, the use of CTb-HRP, like WGA-HRP (see Introduction), will always be limited by the impossibility of efficiently combining it with the immunohistochemical detection of neuroactive substances.
To overcome the problems inherent to the direct histochemical detection of HRP, unconjugated WGA 32 as well as WGA-HRP coupled to gold particles 2 38 43 (WGA-apoHRP-gold) and biotin 50 have also been successfully used as retrograde tracers in combination with immunostaining of second antigens. However, we previously found that CTb is a much more sensitive retrograde tracer than WGA 34 35. Indeed, injections of 0.2 and 0.1 µl of WGA at the same concentration and volume as CTb in the same structures resulted in sites twice as large in diameter than those of CTb (approximately 2000 µm and 1500 µm respectively). Moreover, even with such larger sites, the number of retrogradely labeled cells in the same structures was twice as small 34 35. In addition, in the case of WGA, numerous heavily labeled cells and dendrites surrounded the site making it difficult to determine its extent and the proximate afferents (unpublished results). In contrast, the limits of the CTb injections sites were very sharp, thus making the study of local afferent connections possible. Taken together, these data show that CTb is a much more sensitive retrograde tracer than WGA in the CNS and this prompted us to develop the use of this tracer for studying pathways in the CNS of the cat 14 15 34-36 58-60.
In agreement with these results, Behzadi et al. 5 recently reported that CTb recognized by immunohistochemistry is a much more sensitive tracer in the CNS than WGA-HRP revealed by the TMB method. Indeed, these authors found that the injection sites were less sharply demarcated from the surrounding tissue and the number of retrogradely labeled neurons was markedly inferior when using WGA-HRP instead of CTb.
Comparing CT-HRP and WGA-HRP effectiveness as retrograde tracers in the peripheral nervous system, Wan et al. 57 found, after tongue injections of the same volume at the same concentration of these two conjugates, not only that the number of retrogradely labeled cells in the hypoglossal nucleus but also the extent of the site in the tongue were larger in the case of CT-HRP. In addition, Horikawa and Powell 21 reported that, after injections of CTb, WGA (recognized by immunohistochemistry) and their HRP conjugates (revealed by cobalt DAB) in the whiskerpad of rats, the largest number of retrogradely labeled neurons in the facial nucleus was observed with WGA followed by CTb and WGA-HRP.
Taken together, these findings suggest that CTb is a much more sensitive retrograde tracer than WGA and WGA-HRP in the central nervous system but not in the peripheral nervous system. The superior sensitivity of CTb over WGA and WGA-HRP in the CNS may be due to the presence of a greater number of receptors (monogangliosides) to CTb than WGA 52 (N-acetylglucosamine) at the level of the nerve terminals of the CNS, a property not shared by those of the peripheral nervous system.
It remains to be determined whether unconjugated CTb is also a more sensitive and versatile retrograde tracer than the conjugate WGA-Apo-HRP-gold. Indeed, the coupling of a gold particle to WGA-Apo-HRP transforms the characteristic of the tracer. In particular, the diameter of the injection sites is dramatically reduced when using this complex 2 38. The retrogradely labeled cells contain distinct round black deposits sharper than those obtained with CTb and therefore with a higher contrast against the brown deposit obtained after immunohistochemistry of neuroactive substances 2 38. However, the round deposits are not always restricted to the retrogradely labeled neurons, in particular around the site, thus making the study of local afferent connections and the identification of single- and double-labeled cells difficult (refs. 2, 38 and our unpublished results). Moreover, the complex cannot be iontophorized and the pressure injections with micropipettes and Hamilton syringes are often followed by a tissue necrosis and a leak along the track leading to sites with a cigar shape unsuitable for studying deep brain nuclei (refs. 37, 43 and our unpublished data).
The other class of retrograde tracers is composed of the fluorescent probes introduced by Kuypers et al. in 1977 28. The extensive use of these tracers in the last years is ascribable to a number of decisive advantages: they require minimal tissue processing, can be combined to demonstrate collateralizations of neurons 29 55 and coupled with immunohistochemistry to determine the neurotransmitter content of identified pathways 6 19 30 47 51 56. However, many fluorescent tracers are (a) inferior or equal in sensitivity to free HRP visualized with TMB 1 23, (b) retrogradely transported by damaged but also undamaged fibers of passage 1 23 30 47, (c) leak from retrogradely labeled neurons during the immunohistochemical procedure 19 47 51 56 and the microscope observations 24 and (d) they cannot be iotophorized 10. Even recently introduced Fluoro-Gold and fluorescent latex microspheres have same of these drawbacks. Fluoro-Gold is only as sensitive as WGA-HRP visualized with TMB 44 and therefore (see above and Behzadi et al. 5) much less sensitive than unconjugated CTb. In addition, FluoroGold is also subject to fading under microscope observations and after immunohistochemical procedure 25 44 48.
Rhodamine latex microspheres show little diffusion and consequently produce small sharply defined injection sites and in addition resist fading 26. However, in contrast with Fast blue, WGA and CTb, massive injections of rhodamine microspheres in whiskerpad of rats did not label any neurons in the facial nucleus, thus indicating the low sensitivity of this tracer 21.
These data indicate that CTb is a more versatile and sensitive retrograde tracer than WGA and the fluorescent ones.
Another decisive advantage of our technique is that CTb is also anterogradely transported allowing us to directly identify the efferents as well as the afferents of the region or nucleus studied. Indeed, we demonstrated that CTb is a very powerful anterograde tracer transported via a slow mechanism with an estimated rate of 6-8 mm/day. We further showed that when using strep tavidin-HRP immunohistochemistry, the morphology of the CTb labeled axons and axon terminals was distinctly visible including boutons en passant, fine collateral branches and various terminal specializations just like PHAL 16. One of the drawbacks of CTb is that the tracer is also visualized in lesioned axons, making the interpretation of the data delicate. However, this artefactual labeling is dramatically reduced by using iontophoresis. Nevertheless, other important PHAL advantages are the preferential transport in the anterograde direction and the labeling of fibers directly traced from the population of neurons that was completely filled by the tracer 16.
The only serious drawback of our technique may be that visualization of transported CTb requires the sandwiching of antibodies and streptavidin-HRP and therefore is time-consuming and expensive. But we feel the improvement to be worth the effort. Moreover, this apparent disadvantage can be turned to a decisive one. Indeed, although not addressed in the present study, it is possible to:
- use many different immunohistochemical techniques to reveal CTb, e.g. streptavidin or a second IgG conjugated to gold or a fluorochrome. Such procedures may be combined for example with immunofluorescence of neuroactive substances using two different fluorochromes;
- combine the use of CTb with that of WGA (using the chromogen DAB and DAB-nickel or two different fluorescent labeled IgG or streptavidin) or fluorescent tracers to determine the collaterals of neurons. We recently successfully used a combination of WGA and CTb recognized with DAB and DAB-nickel to identify the collaterals from the hypothalamus to the neurointermediate lobe of the hypophysis and the median eminence 60.
Finally, it is possible to make electrophysiological recordings from the injection pipette to define structures prior to injections.
Figure 1
Click on photomicrographs A,B,C or D to get it bigger

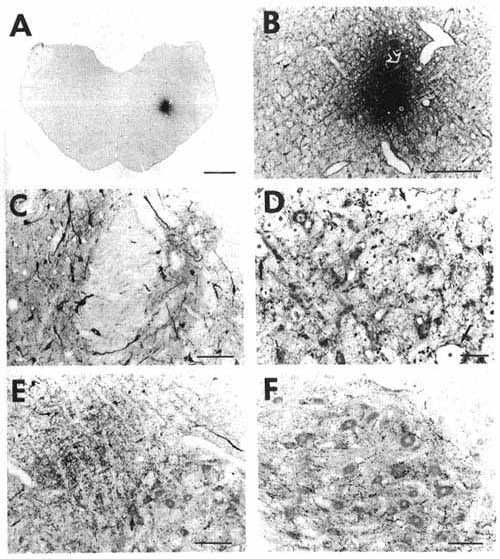
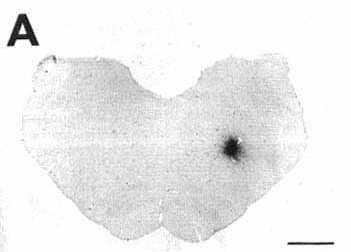
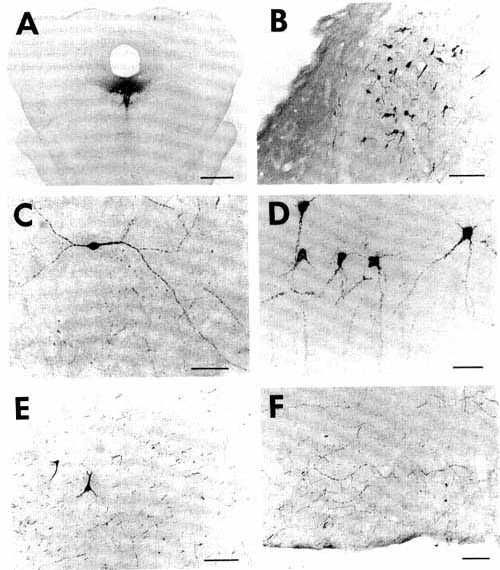
A: overview of a frontal section showing
an unconjugated cholera toxin B subunit (CTb) injection site in the ventrolateral
part of the periaqueduetal gray in a eat with 72 h of survival including
48 h of colchicine treatment (case C116).
Bar = 2 mm.
Note that at this magnification the extent of the site is overestimated when compared with D. For this reason we used the same enlargement in Figs. 1A, 2A and 3A in order to directly compare the size of the different injection sites.
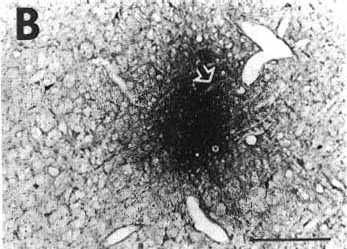
B,D: photomicrographs of adjacent sections showing the same CTb injection site stained either with the biotinylated swine anti-goat IgG and the ABC-HRP complex (B) or the biotinylated donkey anti-goat IgG and the streptavidin-HRP (D). Note that the aspect but not the size of the site changes according to the system of detection.
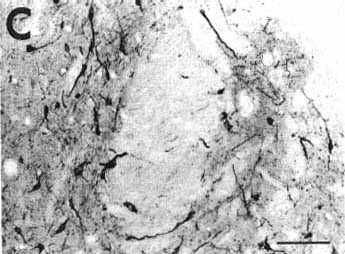
C: photomicrograph showing the extent of necrosis in the center of the pressure injection site in a counterstained section in the proximity of that shown in B and D.
Bars in B,C,D = 500 µm.
Figure 1A
A: overview of a frontal section showing
an unconjugated cholera toxin B subunit (CTb) injection site in the ventrolateral
part of the periaqueduetal gray in a eat with 72 h of survival including
48 h of colchicine treatment (case C116).
Bar = 2 mm.
Note that at this magnification the extent of the site is overestimated when compared with D. For this reason we used the same enlargement in Figs. 1A, 2A and 3A in order to directly compare the size of the different injection sites.
B,D: photomicrographs of adjacent sections showing the same CTb injection site stained either with the biotinylated swine anti-goat IgG and the ABC-HRP complex (B) or the biotinylated donkey anti-goat IgG and the streptavidin-HRP (D). Note that the aspect but not the size of the site changes according to the system of detection.
C: photomicrograph showing the extent of necrosis in the center of the pressure injection site in a counterstained section in the proximity of that shown in B and D.
Bars in B,C,D = 500 µm.
Figure 1B
A: overview of a frontal section showing
an unconjugated cholera toxin B subunit (CTb) injection site in the ventrolateral
part of the periaqueduetal gray in a eat with 72 h of survival including
48 h of colchicine treatment (case C116).
Bar = 2 mm.
Note that at this magnification the extent of the site is overestimated when compared with D. For this reason we used the same enlargement in Figs. 1A, 2A and 3A in order to directly compare the size of the different injection sites.
B,D: photomicrographs of adjacent sections showing the same CTb injection site stained either with the biotinylated swine anti-goat IgG and the ABC-HRP complex (B) or the biotinylated donkey anti-goat IgG and the streptavidin-HRP (D). Note that the aspect but not the size of the site changes according to the system of detection.
C: photomicrograph showing the extent of necrosis in the center of the pressure injection site in a counterstained section in the proximity of that shown in B and D.
Bars in B,C,D = 500 µm.
Figure 1C
A: overview of a frontal section showing
an unconjugated cholera toxin B subunit (CTb) injection site in the ventrolateral
part of the periaqueduetal gray in a eat with 72 h of survival including
48 h of colchicine treatment (case C116).
Bar = 2 mm.
Note that at this magnification the extent of the site is overestimated when compared with D. For this reason we used the same enlargement in Figs. 1A, 2A and 3A in order to directly compare the size of the different injection sites.
B,D: photomicrographs of adjacent sections showing the same CTb injection site stained either with the biotinylated swine anti-goat IgG and the ABC-HRP complex (B) or the biotinylated donkey anti-goat IgG and the streptavidin-HRP (D). Note that the aspect but not the size of the site changes according to the system of detection.
C: photomicrograph showing the extent of necrosis in the center of the pressure injection site in a counterstained section in the proximity of that shown in B and D.
Bars in B,C,D = 500 µm.
Figure 1D
A: overview of a frontal section showing
an unconjugated cholera toxin B subunit (CTb) injection site in the ventrolateral
part of the periaqueduetal gray in a eat with 72 h of survival including
48 h of colchicine treatment (case C116).
Bar = 2 mm.
Note that at this magnification the extent of the site is overestimated when compared with D. For this reason we used the same enlargement in Figs. 1A, 2A and 3A in order to directly compare the size of the different injection sites.
B,D: photomicrographs of adjacent sections showing the same CTb injection site stained either with the biotinylated swine anti-goat IgG and the ABC-HRP complex (B) or the biotinylated donkey anti-goat IgG and the streptavidin-HRP (D). Note that the aspect but not the size of the site changes according to the system of detection.
C: photomicrograph showing the extent of necrosis in the center of the pressure injection site in a counterstained section in the proximity of that shown in B and D.
Bars in B,C,D = 500 µm.
Figure 2
Click on photomicrographs A,B,C,D,E or F to get it bigger
A: overview of a frontal section at the
level of the medulla oblongata showing a typical iontophoretic injection
site in the nucleus reticularis parvicellularis (case K120) using a 2-µA
pulsed positive current for 30 min.
Bar= 2 mm.
B: higher magnification of the site shown
in A precisely illustrating its extent and localization. The stars and
arrows designate the same vessels or fiber bundle in B and D.
Bar = 400 µm.
D: adjacent section to that shown in
B at a higher magnification, counterstained with Cresyl violet and immunostained
with serotonin, showing the presence of counterstained cell bodies and
serotonin immunoreactive fibers in the site proving the absence of tissue
necrosis.
Bar =50 µm.
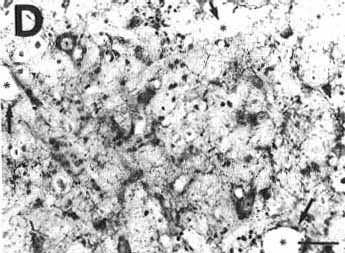
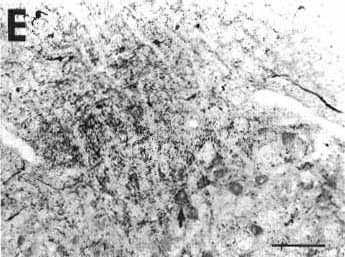
C: photomicrograph illustrating retrogradely
labeled cells in the medial (left part) and lateral (right part) divisions
of the nucleus of the solitary tract. Note also the presence of punctate
anterograde labeling in the same areas.
Bar = 100 µm.
E: photomicrograph showing anterogradely
labeled fibers organized as a bundle running dorsally to the facial nucleus
approximately 2 mm rostral to the site shown in A
and B. Varicose fibers inside the facial nucleus
sometimes formed basket-like structures around motoneuron somata (arrow).
Bar = 200 µm.
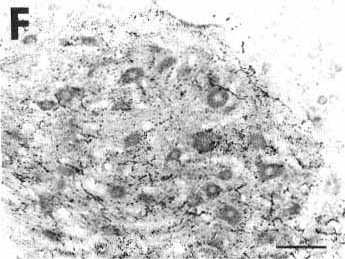
F: photomicrograph showing the great
number of anterogradely labeled varicose fibers in the hypoglossal nucleus
after the CTb iontophoretic injection shown in A
and B.
Bar = 100 µm.
To optimize the CTb immunostaining shown in C, E and F, the sections were incubated 3-4 days in CTb antiserum (1: 40,000) at 4 °C followed by sequential incubations overnight at 4 °C in the biotinylated donkey anti-goat IgG (1:2,000) and the streptavidin-HRP (1:40,000). Note that with such maximal conditions, we obtained a weak counterstaining of the sections ideally suited for accurate localization of CTb immunostained material.
Figure 2A
A: overview of a frontal section at the
level of the medulla oblongata showing a typical iontophoretic injection
site in the nucleus reticularis parvicellularis (case K120) using a 2-µA
pulsed positive current for 30 min.
Bar= 2 mm.
B: higher magnification of the site shown
in A precisely illustrating its extent and localization. The stars and
arrows designate the same vessels or fiber bundle in B and D.
Bar = 400 µm.
D: adjacent section to that shown in
B at a higher magnification, counterstained with Cresyl violet and immunostained
with serotonin, showing the presence of counterstained cell bodies and
serotonin immunoreactive fibers in the site proving the absence of tissue
necrosis.
Bar =50 µm.
C: photomicrograph illustrating retrogradely
labeled cells in the medial (left part) and lateral (right part) divisions
of the nucleus of the solitary tract. Note also the presence of punctate
anterograde labeling in the same areas.
Bar = 100 µm.
E: photomicrograph showing anterogradely
labeled fibers organized as a bundle running dorsally to the facial nucleus
approximately 2 mm rostral to the site shown in A
and B. Varicose fibers inside the facial nucleus
sometimes formed basket-like structures around motoneuron somata (arrow).
Bar = 200 µm.
F: photomicrograph showing the great
number of anterogradely labeled varicose fibers in the hypoglossal nucleus
after the CTb iontophoretic injection shown in A
and B.
Bar = 100 µm.
To optimize the CTb immunostaining shown in C, E and F, the sections were incubated 3-4 days in CTb antiserum (1: 40,000) at 4 °C followed by sequential incubations overnight at 4 °C in the biotinylated donkey anti-goat IgG (1:2,000) and the streptavidin-HRP (1:40,000). Note that with such maximal conditions, we obtained a weak counterstaining of the sections ideally suited for accurate localization of CTb immunostained material.
Figure 2B
A: overview of a frontal section at the
level of the medulla oblongata showing a typical iontophoretic injection
site in the nucleus reticularis parvicellularis (case K120) using a 2-µA
pulsed positive current for 30 min.
Bar= 2 mm.
B: higher magnification of the site shown
in A precisely illustrating its extent and localization. The stars and
arrows designate the same vessels or fiber bundle in B and D.
Bar = 400 µm.
D: adjacent section to that shown in
B at a higher magnification, counterstained with Cresyl violet and immunostained
with serotonin, showing the presence of counterstained cell bodies and
serotonin immunoreactive fibers in the site proving the absence of tissue
necrosis.
Bar =50 µm.
C: photomicrograph illustrating retrogradely
labeled cells in the medial (left part) and lateral (right part) divisions
of the nucleus of the solitary tract. Note also the presence of punctate
anterograde labeling in the same areas.
Bar = 100 µm.
E: photomicrograph showing anterogradely
labeled fibers organized as a bundle running dorsally to the facial nucleus
approximately 2 mm rostral to the site shown in A
and B. Varicose fibers inside the facial nucleus
sometimes formed basket-like structures around motoneuron somata (arrow).
Bar = 200 µm.
F: photomicrograph showing the great
number of anterogradely labeled varicose fibers in the hypoglossal nucleus
after the CTb iontophoretic injection shown in A
and B.
Bar = 100 µm.
To optimize the CTb immunostaining shown in C, E and F, the sections were incubated 3-4 days in CTb antiserum (1: 40,000) at 4 °C followed by sequential incubations overnight at 4 °C in the biotinylated donkey anti-goat IgG (1:2,000) and the streptavidin-HRP (1:40,000). Note that with such maximal conditions, we obtained a weak counterstaining of the sections ideally suited for accurate localization of CTb immunostained material.
Figure 2C
A: overview of a frontal section at the
level of the medulla oblongata showing a typical iontophoretic injection
site in the nucleus reticularis parvicellularis (case K120) using a 2-µA
pulsed positive current for 30 min.
Bar= 2 mm.
B: higher magnification of the site shown
in A precisely illustrating its extent and localization. The stars and
arrows designate the same vessels or fiber bundle in B and D.
Bar = 400 µm.
D: adjacent section to that shown in
B at a higher magnification, counterstained with Cresyl violet and immunostained
with serotonin, showing the presence of counterstained cell bodies and
serotonin immunoreactive fibers in the site proving the absence of tissue
necrosis.
Bar =50 µm.
C: photomicrograph illustrating retrogradely
labeled cells in the medial (left part) and lateral (right part) divisions
of the nucleus of the solitary tract. Note also the presence of punctate
anterograde labeling in the same areas.
Bar = 100 µm.
E: photomicrograph showing anterogradely
labeled fibers organized as a bundle running dorsally to the facial nucleus
approximately 2 mm rostral to the site shown in A
and B. Varicose fibers inside the facial nucleus
sometimes formed basket-like structures around motoneuron somata (arrow).
Bar = 200 µm.
F: photomicrograph showing the great
number of anterogradely labeled varicose fibers in the hypoglossal nucleus
after the CTb iontophoretic injection shown in A
and B.
Bar = 100 µm.
To optimize the CTb immunostaining shown in C, E and F, the sections were incubated 3-4 days in CTb antiserum (1: 40,000) at 4 °C followed by sequential incubations overnight at 4 °C in the biotinylated donkey anti-goat IgG (1:2,000) and the streptavidin-HRP (1:40,000). Note that with such maximal conditions, we obtained a weak counterstaining of the sections ideally suited for accurate localization of CTb immunostained material.
Figure 2D
A: overview of a frontal section at the
level of the medulla oblongata showing a typical iontophoretic injection
site in the nucleus reticularis parvicellularis (case K120) using a 2-µA
pulsed positive current for 30 min.
Bar= 2 mm.
B: higher magnification of the site shown
in A precisely illustrating its extent and localization. The stars and
arrows designate the same vessels or fiber bundle in B and D.
Bar = 400 µm.
D: adjacent section to that shown in
B at a higher magnification, counterstained with Cresyl violet and immunostained
with serotonin, showing the presence of counterstained cell bodies and
serotonin immunoreactive fibers in the site proving the absence of tissue
necrosis.
Bar =50 µm.
C: photomicrograph illustrating retrogradely
labeled cells in the medial (left part) and lateral (right part) divisions
of the nucleus of the solitary tract. Note also the presence of punctate
anterograde labeling in the same areas.
Bar = 100 µm.
E: photomicrograph showing anterogradely
labeled fibers organized as a bundle running dorsally to the facial nucleus
approximately 2 mm rostral to the site shown in A
and B. Varicose fibers inside the facial nucleus
sometimes formed basket-like structures around motoneuron somata (arrow).
Bar = 200 µm.
F: photomicrograph showing the great
number of anterogradely labeled varicose fibers in the hypoglossal nucleus
after the CTb iontophoretic injection shown in A
and B.
Bar = 100 µm.
To optimize the CTb immunostaining shown in C, E and F, the sections were incubated 3-4 days in CTb antiserum (1: 40,000) at 4 °C followed by sequential incubations overnight at 4 °C in the biotinylated donkey anti-goat IgG (1:2,000) and the streptavidin-HRP (1:40,000). Note that with such maximal conditions, we obtained a weak counterstaining of the sections ideally suited for accurate localization of CTb immunostained material.
Figure 2E
A: overview of a frontal section at the
level of the medulla oblongata showing a typical iontophoretic injection
site in the nucleus reticularis parvicellularis (case K120) using a 2-µA
pulsed positive current for 30 min.
Bar= 2 mm.
B: higher magnification of the site shown
in A precisely illustrating its extent and localization. The stars and
arrows designate the same vessels or fiber bundle in B and D.
Bar = 400 µm.
D: adjacent section to that shown in
B at a higher magnification, counterstained with Cresyl violet and immunostained
with serotonin, showing the presence of counterstained cell bodies and
serotonin immunoreactive fibers in the site proving the absence of tissue
necrosis.
Bar =50 µm.
C: photomicrograph illustrating retrogradely
labeled cells in the medial (left part) and lateral (right part) divisions
of the nucleus of the solitary tract. Note also the presence of punctate
anterograde labeling in the same areas.
Bar = 100 µm.
E: photomicrograph showing anterogradely
labeled fibers organized as a bundle running dorsally to the facial nucleus
approximately 2 mm rostral to the site shown in A
and B. Varicose fibers inside the facial nucleus
sometimes formed basket-like structures around motoneuron somata (arrow).
Bar = 200 µm.
F: photomicrograph showing the great
number of anterogradely labeled varicose fibers in the hypoglossal nucleus
after the CTb iontophoretic injection shown in A
and B.
Bar = 100 µm.
To optimize the CTb immunostaining shown in C, E and F, the sections were incubated 3-4 days in CTb antiserum (1: 40,000) at 4 °C followed by sequential incubations overnight at 4 °C in the biotinylated donkey anti-goat IgG (1:2,000) and the streptavidin-HRP (1:40,000). Note that with such maximal conditions, we obtained a weak counterstaining of the sections ideally suited for accurate localization of CTb immunostained material.
Figure 2F
A: overview of a frontal section at the
level of the medulla oblongata showing a typical iontophoretic injection
site in the nucleus reticularis parvicellularis (case K120) using a 2-µA
pulsed positive current for 30 min.
Bar= 2 mm.
B: higher magnification of the site shown
in A precisely illustrating its extent and localization. The stars and
arrows designate the same vessels or fiber bundle in B and D.
Bar = 400 µm.
D: adjacent section to that shown in
B at a higher magnification, counterstained with Cresyl violet and immunostained
with serotonin, showing the presence of counterstained cell bodies and
serotonin immunoreactive fibers in the site proving the absence of tissue
necrosis.
Bar =50 µm.
C: photomicrograph illustrating retrogradely
labeled cells in the medial (left part) and lateral (right part) divisions
of the nucleus of the solitary tract. Note also the presence of punctate
anterograde labeling in the same areas.
Bar = 100 µm.
E: photomicrograph showing anterogradely
labeled fibers organized as a bundle running dorsally to the facial nucleus
approximately 2 mm rostral to the site shown in A
and B. Varicose fibers inside the facial nucleus
sometimes formed basket-like structures around motoneuron somata (arrow).
Bar = 200 µm.
F: photomicrograph showing the great
number of anterogradely labeled varicose fibers in the hypoglossal nucleus
after the CTb iontophoretic injection shown in A
and B.
Bar = 100 µm.
To optimize the CTb immunostaining shown in C, E and F, the sections were incubated 3-4 days in CTb antiserum (1: 40,000) at 4 °C followed by sequential incubations overnight at 4 °C in the biotinylated donkey anti-goat IgG (1:2,000) and the streptavidin-HRP (1:40,000). Note that with such maximal conditions, we obtained a weak counterstaining of the sections ideally suited for accurate localization of CTb immunostained material.
Figure 3
Click on photomicrographs A,B,C,D,E or F to get it bigger
A: overview of a section at pontine level
showing a large iontophoretic injection site (2 uA, 60 min) restricted
to the nucleus raphe dorsalis in a cat with 18 days of survival (case
R121) The other photomicrographs of this figure illustrate examples of
retrograde and anterograde labeling obtained in this case.
Bar = 2 mm.
B: low power photomicrograph showing
the presence of numerous retrogradely labeled cells in the lateral habenular
nucleus, indicating that the quantity of CTb in these retrogradely labeled
cells rather than decreasing, increased after 18 days of survival in this
well-known afferent to the nucleus raphe dorsalis.
Bar = 100 µm.
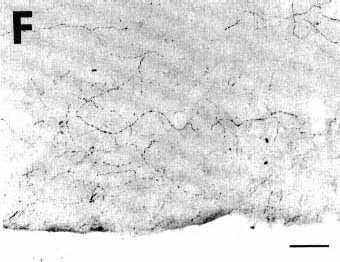
C,D: photomicrographs
of retrogradely labeled neurons in the basal forebrain (C) and the insular agranular cortex (D). Note the very extensive labeling of the primary and
secondary dendritic branches in the neuron shown in C and of the large dendrites of the pyramidal cells shown
in D.
Bar = 50 µm.
E: photomicrograph illustrating in the
median forebrain bundle the presence of two retrogradely labeled cell
bodies surrounded by the bundle of anterogradely labeled fibers arising
from the nucleus raphe dorsalis. Note that these fibers are passing and
therefore do not display varicosities.
Bar = 100 µm.
F: photomicrograph illustrating the presence
of numerous anterogradely labeled fibers with terminal-like swellings
in the superficial layers of the caudal part of the pyriform cortex.
Bar = 50 µm.
Figure 3A
A: overview of a section at pontine level
showing a large iontophoretic injection site (2 uA, 60 min) restricted
to the nucleus raphe dorsalis in a cat with 18 days of survival (case
R121) The other photomicrographs of this figure illustrate examples of
retrograde and anterograde labeling obtained in this case.
Bar = 2 mm.
B: low power photomicrograph showing
the presence of numerous retrogradely labeled cells in the lateral habenular
nucleus, indicating that the quantity of CTb in these retrogradely labeled
cells rather than decreasing, increased after 18 days of survival in this
well-known afferent to the nucleus raphe dorsalis.
Bar = 100 µm.
C,D: photomicrographs
of retrogradely labeled neurons in the basal forebrain (C) and the insular agranular cortex (D). Note the very extensive labeling of the primary and
secondary dendritic branches in the neuron shown in C and of the large dendrites of the pyramidal cells shown
in D.
Bar = 50 µm.
E: photomicrograph illustrating in the
median forebrain bundle the presence of two retrogradely labeled cell
bodies surrounded by the bundle of anterogradely labeled fibers arising
from the nucleus raphe dorsalis. Note that these fibers are passing and
therefore do not display varicosities.
Bar = 100 µm.
F: photomicrograph illustrating the presence
of numerous anterogradely labeled fibers with terminal-like swellings
in the superficial layers of the caudal part of the pyriform cortex.
Bar = 50 µm.
Figure 3B
A: overview of a section at pontine level
showing a large iontophoretic injection site (2 uA, 60 min) restricted
to the nucleus raphe dorsalis in a cat with 18 days of survival (case
R121) The other photomicrographs of this figure illustrate examples of
retrograde and anterograde labeling obtained in this case.
Bar = 2 mm.
B: low power photomicrograph showing
the presence of numerous retrogradely labeled cells in the lateral habenular
nucleus, indicating that the quantity of CTb in these retrogradely labeled
cells rather than decreasing, increased after 18 days of survival in this
well-known afferent to the nucleus raphe dorsalis.
Bar = 100 µm.
C,D: photomicrographs
of retrogradely labeled neurons in the basal forebrain (C) and the insular agranular cortex (D). Note the very extensive labeling of the primary and
secondary dendritic branches in the neuron shown in C and of the large dendrites of the pyramidal cells shown
in D.
Bar = 50 µm.
E: photomicrograph illustrating in the
median forebrain bundle the presence of two retrogradely labeled cell
bodies surrounded by the bundle of anterogradely labeled fibers arising
from the nucleus raphe dorsalis. Note that these fibers are passing and
therefore do not display varicosities.
Bar = 100 µm.
F: photomicrograph illustrating the presence
of numerous anterogradely labeled fibers with terminal-like swellings
in the superficial layers of the caudal part of the pyriform cortex.
Bar = 50 µm.
Figure 3C
A: overview of a section at pontine level
showing a large iontophoretic injection site (2 uA, 60 min) restricted
to the nucleus raphe dorsalis in a cat with 18 days of survival (case
R121) The other photomicrographs of this figure illustrate examples of
retrograde and anterograde labeling obtained in this case.
Bar = 2 mm.
B: low power photomicrograph showing
the presence of numerous retrogradely labeled cells in the lateral habenular
nucleus, indicating that the quantity of CTb in these retrogradely labeled
cells rather than decreasing, increased after 18 days of survival in this
well-known afferent to the nucleus raphe dorsalis.
Bar = 100 µm.
C,D: photomicrographs
of retrogradely labeled neurons in the basal forebrain (C) and the insular agranular cortex (D). Note the very extensive labeling of the primary and
secondary dendritic branches in the neuron shown in C and of the large dendrites of the pyramidal cells shown
in D.
Bar = 50 µm.
E: photomicrograph illustrating in the
median forebrain bundle the presence of two retrogradely labeled cell
bodies surrounded by the bundle of anterogradely labeled fibers arising
from the nucleus raphe dorsalis. Note that these fibers are passing and
therefore do not display varicosities.
Bar = 100 µm.
F: photomicrograph illustrating the presence
of numerous anterogradely labeled fibers with terminal-like swellings
in the superficial layers of the caudal part of the pyriform cortex.
Bar = 50 µm.
Figure 3D
A: overview of a section at pontine level
showing a large iontophoretic injection site (2 uA, 60 min) restricted
to the nucleus raphe dorsalis in a cat with 18 days of survival (case
R121) The other photomicrographs of this figure illustrate examples of
retrograde and anterograde labeling obtained in this case.
Bar = 2 mm.
B: low power photomicrograph showing
the presence of numerous retrogradely labeled cells in the lateral habenular
nucleus, indicating that the quantity of CTb in these retrogradely labeled
cells rather than decreasing, increased after 18 days of survival in this
well-known afferent to the nucleus raphe dorsalis.
Bar = 100 µm.
C,D: photomicrographs
of retrogradely labeled neurons in the basal forebrain (C) and the insular agranular cortex (D). Note the very extensive labeling of the primary and
secondary dendritic branches in the neuron shown in C and of the large dendrites of the pyramidal cells shown
in D.
Bar = 50 µm.
E: photomicrograph illustrating in the
median forebrain bundle the presence of two retrogradely labeled cell
bodies surrounded by the bundle of anterogradely labeled fibers arising
from the nucleus raphe dorsalis. Note that these fibers are passing and
therefore do not display varicosities.
Bar = 100 µm.
F: photomicrograph illustrating the presence
of numerous anterogradely labeled fibers with terminal-like swellings
in the superficial layers of the caudal part of the pyriform cortex.
Bar = 50 µm.
Figure 3E
A: overview of a section at pontine level
showing a large iontophoretic injection site (2 uA, 60 min) restricted
to the nucleus raphe dorsalis in a cat with 18 days of survival (case
R121) The other photomicrographs of this figure illustrate examples of
retrograde and anterograde labeling obtained in this case.
Bar = 2 mm.
B: low power photomicrograph showing
the presence of numerous retrogradely labeled cells in the lateral habenular
nucleus, indicating that the quantity of CTb in these retrogradely labeled
cells rather than decreasing, increased after 18 days of survival in this
well-known afferent to the nucleus raphe dorsalis.
Bar = 100 µm.
C,D: photomicrographs
of retrogradely labeled neurons in the basal forebrain (C) and the insular agranular cortex (D). Note the very extensive labeling of the primary and
secondary dendritic branches in the neuron shown in C and of the large dendrites of the pyramidal cells shown
in D.
Bar = 50 µm.
E: photomicrograph illustrating in the
median forebrain bundle the presence of two retrogradely labeled cell
bodies surrounded by the bundle of anterogradely labeled fibers arising
from the nucleus raphe dorsalis. Note that these fibers are passing and
therefore do not display varicosities.
Bar = 100 µm.
F: photomicrograph illustrating the presence
of numerous anterogradely labeled fibers with terminal-like swellings
in the superficial layers of the caudal part of the pyriform cortex.
Bar = 50 µm.
Figure 3F
A: overview of a section at pontine level
showing a large iontophoretic injection site (2 uA, 60 min) restricted
to the nucleus raphe dorsalis in a cat with 18 days of survival (case
R121) The other photomicrographs of this figure illustrate examples of
retrograde and anterograde labeling obtained in this case.
Bar = 2 mm.
B: low power photomicrograph showing
the presence of numerous retrogradely labeled cells in the lateral habenular
nucleus, indicating that the quantity of CTb in these retrogradely labeled
cells rather than decreasing, increased after 18 days of survival in this
well-known afferent to the nucleus raphe dorsalis.
Bar = 100 µm.
C,D: photomicrographs
of retrogradely labeled neurons in the basal forebrain (C) and the insular agranular cortex (D). Note the very extensive labeling of the primary and
secondary dendritic branches in the neuron shown in C and of the large dendrites of the pyramidal cells shown
in D.
Bar = 50 µm.
E: photomicrograph illustrating in the
median forebrain bundle the presence of two retrogradely labeled cell
bodies surrounded by the bundle of anterogradely labeled fibers arising
from the nucleus raphe dorsalis. Note that these fibers are passing and
therefore do not display varicosities.
Bar = 100 µm.
F: photomicrograph illustrating the presence
of numerous anterogradely labeled fibers with terminal-like swellings
in the superficial layers of the caudal part of the pyriform cortex.
Bar = 50 µm.
Figure 4
Click on photomicrographs A,B,C or D to get it bigger
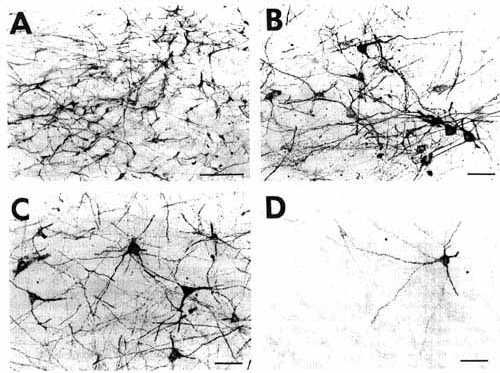
A-D: photomicrographs of 50 µm thick vibratome sections in a cat with a 0.2 µl pressure injection of CTb in the rostral part of the inferior olivary complex and 48 h of survival including 24 h of colchicine treatment (case F111). Note the very extensive labeling of the dendritic trees and the well preserved morphology of the retrogradely labeled cells found in the interstitial nucleus of Cajal (A), the posterior pretectal nucleus (B and C) and the medial preoptic area (D).
Bars = 200 µm (A) and 50 µm (B,C,D).
Figure 4A
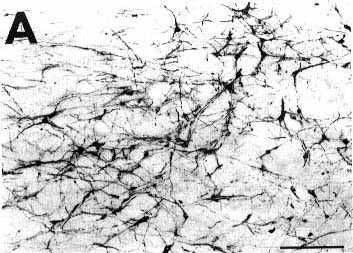
A-D: photomicrographs of 50 µm thick vibratome sections in a cat with a 0.2 µl pressure injection of CTb in the rostral part of the inferior olivary complex and 48 h of survival including 24 h of colchicine treatment (case F111). Note the very extensive labeling of the dendritic trees and the well preserved morphology of the retrogradely labeled cells found in the interstitial nucleus of Cajal (A), the posterior pretectal nucleus (B and C) and the medial preoptic area (D).
Bars = 200 µm (A) and 50 µm (B,C,D).
Figure 4B
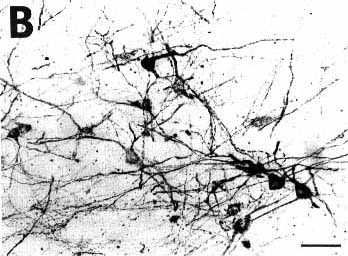
A-D: photomicrographs of 50 µm thick vibratome sections in a cat with a 0.2 µl pressure injection of CTb in the rostral part of the inferior olivary complex and 48 h of survival including 24 h of colchicine treatment (case F111). Note the very extensive labeling of the dendritic trees and the well preserved morphology of the retrogradely labeled cells found in the interstitial nucleus of Cajal (A), the posterior pretectal nucleus (B and C) and the medial preoptic area (D).
Bars = 200 µm (A) and 50 µm (B,C,D).
Figure 4C
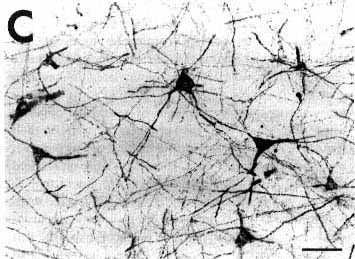
A-D: photomicrographs of 50 µm thick vibratome sections in a cat with a 0.2 µl pressure injection of CTb in the rostral part of the inferior olivary complex and 48 h of survival including 24 h of colchicine treatment (case F111). Note the very extensive labeling of the dendritic trees and the well preserved morphology of the retrogradely labeled cells found in the interstitial nucleus of Cajal (A), the posterior pretectal nucleus (B and C) and the medial preoptic area (D).
Bars = 200 µm (A) and 50 µm (B,C,D).
Figure 4D
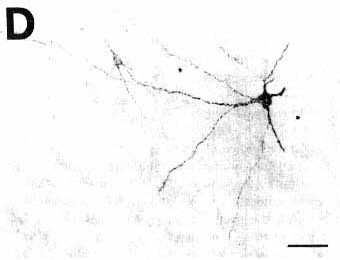
A-D: photomicrographs of 50 µm thick vibratome sections in a cat with a 0.2 µl pressure injection of CTb in the rostral part of the inferior olivary complex and 48 h of survival including 24 h of colchicine treatment (case F111). Note the very extensive labeling of the dendritic trees and the well preserved morphology of the retrogradely labeled cells found in the interstitial nucleus of Cajal (A), the posterior pretectal nucleus (B and C) and the medial preoptic area (D).
Bars = 200 µm (A) and 50 µm (B,C,D).
Figure 5
Click on photomicrographs A,B,C or D to get it bigger
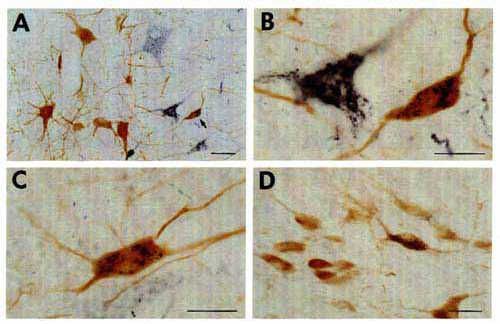
A-D: color photomicrographs illustrating CTb-labeled cells charaeterized hy black punctate labeling and AADC-(A-C) and ChAT (D)-immunoreactive cells characterized by diffuse light brown staining. Double-labeled cells are easily distinguished in the nucleus raphe magnus (A-C) and the pedunculopontine nucleus (D) in the pons. The arrow in A indicates the double-labeled cell shown at a higher magnification in B.
Bars = 50 µm (A) and 25 µm (B-D).
Nomenclature according to Berman 4.
Figure 5A
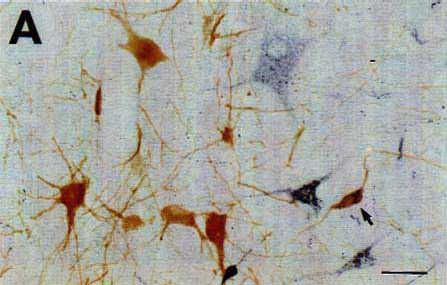
A-D: color photomicrographs illustrating CTb-labeled cells charaeterized hy black punctate labeling and AADC-(A-C) and ChAT (D)-immunoreactive cells characterized by diffuse light brown staining. Double-labeled cells are easily distinguished in the nucleus raphe magnus (A-C) and the pedunculopontine nucleus (D) in the pons. The arrow in A indicates the double-labeled cell shown at a higher magnification in B.
Bars = 50 µm (A) and 25 µm (B-D).
Nomenclature according to Berman 4.
Figure 5B
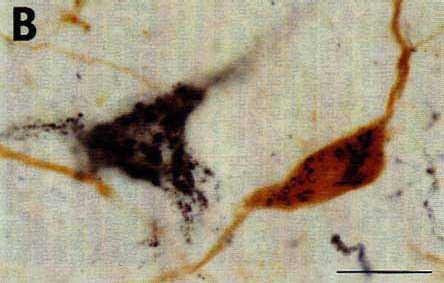
A-D: color photomicrographs illustrating CTb-labeled cells charaeterized hy black punctate labeling and AADC-(A-C) and ChAT (D)-immunoreactive cells characterized by diffuse light brown staining. Double-labeled cells are easily distinguished in the nucleus raphe magnus (A-C) and the pedunculopontine nucleus (D) in the pons. The arrow in A indicates the double-labeled cell shown at a higher magnification in B.
Bars = 50 µm (A) and 25 µm (B-D).
Nomenclature according to Berman 4.
Figure 5C
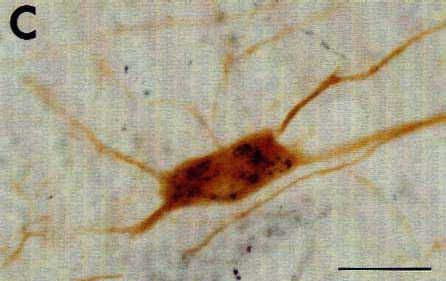
A-D: color photomicrographs illustrating CTb-labeled cells charaeterized hy black punctate labeling and AADC-(A-C) and ChAT (D)-immunoreactive cells characterized by diffuse light brown staining. Double-labeled cells are easily distinguished in the nucleus raphe magnus (A-C) and the pedunculopontine nucleus (D) in the pons. The arrow in A indicates the double-labeled cell shown at a higher magnification in B.
Bars = 50 µm (A) and 25 µm (B-D).
Nomenclature according to Berman 4.
Figure 5D

A-D: color photomicrographs illustrating CTb-labeled cells charaeterized hy black punctate labeling and AADC-(A-C) and ChAT (D)-immunoreactive cells characterized by diffuse light brown staining. Double-labeled cells are easily distinguished in the nucleus raphe magnus (A-C) and the pedunculopontine nucleus (D) in the pons. The arrow in A indicates the double-labeled cell shown at a higher magnification in B.
Bars = 50 µm (A) and 25 µm (B-D).
Nomenclature according to Berman 4.